Quickstart
Synthetic example
Effect of the history parameter
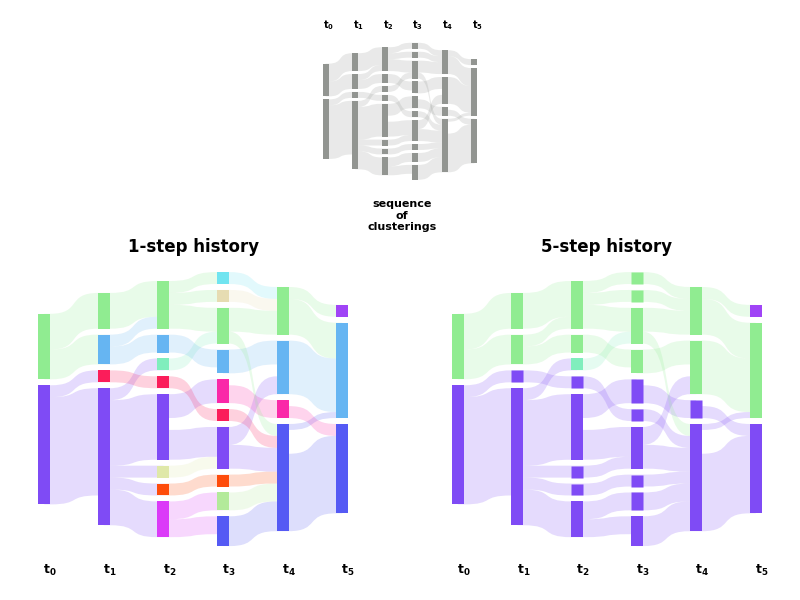
Effect of the history parameter on a synthetic dynamic community structure. Derived from Fig.2 of https://arxiv.org/abs/1912.04261.
from copy import deepcopy
from matplotlib import pyplot as plt
import matplotlib.gridspec as gridspec

from majortrack import MajorTrack

SMALL_SIZE, MEDIUM_SIZE, BIGGER_SIZE = 12, 14, 18
plt.rc('font', size=SMALL_SIZE)          # controls default text sizes
plt.rc('axes', titlesize=SMALL_SIZE)     # fontsize of the axes title
plt.rc('axes', labelsize=MEDIUM_SIZE)    # fontsize of the x and y labels
plt.rc('xtick', labelsize=SMALL_SIZE)    # fontsize of the tick labels
plt.rc('ytick', labelsize=SMALL_SIZE)    # fontsize of the tick labels
plt.rc('legend', fontsize=SMALL_SIZE)    # legend fontsize
plt.rc('figure', titlesize=BIGGER_SIZE)  # fontsize of the figure title

# #############################################################################
# Define the data time-sequence data
_time_windows = [
        [-0.5, 0.5], [0.5, 1.5], [1.5, 2.5], [2.5, 3.5], [3.5, 4.5], [4.5, 5.5]
        ]
time_windows = [[10*el for el in tw] for tw in _time_windows]
# 1. The grouping
# # at t=0:
t0g0 = [*range(20)]
t0g1 = [*range(35, 46)]
# # at t=1:
t1g0 = [*range(2, 25)]
t1g1 = [0, 1]
t1g2 = [*range(35, 41)]
t1g3 = [*range(41, 46)]
# # at t=2:
t2g4 = [0, 1]
t2g3 = [2, 3]
t2g2 = [*range(4, 10)]
t2g0 = [10, 11]
t2g1 = [*range(12, 23)]
t2g5 = [23, 24]
t2g6 = [*range(35, 43)]
t2g7 = [43, 44, 45]
# # at t=3:
t3g0 = [0, 1]
t3g1 = [*range(4, 7)] + [25, 26]
t3g2 = [*range(7, 10)]
t3g4 = [*range(10, 17)]
t3g3 = [*range(17, 21)]
t3g5 = [23, 24]
t3g6 = [35, 36]
t3g7 = [37, 38]
t3g8 = [*range(43, 47)]
t3g9 = [39, 40, 41, 42] + [2, 3]
# # at t=4:
t4g0 = [*range(14)] + [*range(23, 27)]
t4g1 = [17, 18, 19]
t4g2 = [*range(14, 17)] + [*range(43, 49)]
t4g3 = [*range(35, 43)]
# # at t=5:
t5g0 = [*range(13)] + [17, 18]
t5g1 = [*range(13, 17)] + [*range(35, 40)] + [*range(42, 49)]
t5g2 = [40, 41]

individuals = [
        set(t0g0 + t0g1),
        set(t1g0+t1g1 + t1g2+t1g3),
        set(t2g0+t2g1+t2g2+t2g3+t2g4+t2g5 + t2g6+t2g7),
        set(t3g0+t3g1+t3g2+t3g3+t3g4+t3g5 + t3g6+t3g7+t3g8+t3g9),
        set(t4g0+t4g1 + t4g2+t4g3),
        set(t5g0 + t5g1+t5g2)
        ]
groupings = [
        [t0g0, t0g1],
        [t1g0, t1g1, t1g2, t1g3],
        [t2g0, t2g1, t2g2, t2g3, t2g4, t2g5, t2g6, t2g7],
        [t3g0, t3g1, t3g2, t3g3, t3g4, t3g5, t3g6, t3g7, t3g8, t3g9],
        [t4g0, t4g1, t4g2, t4g3],
        [t5g0, t5g1, t5g2]
        ]
groupings = [[set(grp) for grp in groups] for groups in groupings]

# #############################################################################
# Initiate the algorithm
mt = MajorTrack(
        clusterings=groupings,
        individuals=individuals,
        history=0,
        timepoints=[tw[0] for tw in time_windows]
    )
mt.get_group_matchup('fraction')
# create the different instances with different history parameters
mt1 = deepcopy(mt)
mt5 = deepcopy(mt)
mt5.history = 5
mt.get_dcs()
mt.get_community_group_membership()
mt.get_community_membership()
mt.get_community_coloring()
# use same colours for other visualizations
comm_colours = list(mt.comm_colours)
sp_commm_color_idx = dict(mt.sp_community_colour_idx)
mt1.comm_colours = list(comm_colours)
mt1.sp_community_colour_idx = dict(sp_commm_color_idx)
mt5.comm_colours = list(comm_colours)
mt5.sp_community_colour_idx = dict(sp_commm_color_idx)
# 1 step memory
mt1.history = 1
mt1.get_dcs()
mt1.get_community_group_membership()
mt1.get_community_membership()
# 5 step memory
mt5.history = 5
mt5.get_dcs()
mt5.get_community_group_membership()
mt5.get_community_membership()

# plotting params
plot_params = {
        'cluster_width': 2,
        'flux_kwargs': {'alpha': 0.2, 'lw': 0.0, 'facecolor': 'cluster'},
        'cluster_kwargs': {'alpha': 1.0, 'lw': 0.0},
        'label_kwargs': {'fontweight': 'heavy'},
        'with_cluster_labels': False,
        'cluster_label': 'group_index',
        'cluster_label_margin': (-1.6, 0.1),
        'x_axis_offset': 0.07,
        'redistribute_vertically': 1,
        'cluster_location': 'center',
        'y_fix': {
            20.0: [('4', '7'), ('0', '1'), ('4', '3')],
            30.0: [('0', '3')]
            }
        }

rawmt = deepcopy(mt1)

# Single
# #############################################################################
# The trace back (memory) part
# the merging illustration
sankey_plot_params = dict(plot_params)
sankey_plot_params.update({
        'merged_edgecolor': 'none',  # 'xkcd:gray',
        'merged_linewidth': 1,
        'cluster_facecolor': 'community',
        'cluster_edgecolor': 'community',
        'flux_facecolor': 'cluster',
        'flux_edgecolor': 'cluster'
        })
# raw image
spp_raw = deepcopy(sankey_plot_params)
spp_raw['l_size'] = 7
spp_raw['cluster_facecolor'] = 'xkcd:gray'
spp_raw['default_cluster_facecolor'] = 'xkcd:gray'

# 1 step
spp_1step = deepcopy(sankey_plot_params)
spp_1step['l_size'] = 9
# 5 step
spp_5step = deepcopy(sankey_plot_params)
spp_5step['l_size'] = 9


def _set_axis(axes, mt, spp, with_xaxis=True):
    axes.axis('equal')
    l_size = spp.pop('l_size', 9)
    mt.get_alluvialdiagram(
            axes,
            invisible_x=not with_xaxis,
            **spp,
            )
    if with_xaxis:
        tp = [
                (t + .5*(mt.slice_widths[i])) + .5*plot_params['cluster_width']
                for i, t in enumerate(mt.timepoints)
                ]
        axes.set_xticks(tp, minor=False)
        # ax_tb3.xaxis.tick_top()
        axes.set_xticklabels(
                [
                    r'$\mathbf{{t_{0}}}$'.format(idx)
                    for idx in range(6)
                    ],
                minor=False,
                size=l_size
                )
        axes.tick_params(axis=u'x', which=u'both', length=0)
        plt.setp(axes.get_xticklabels(), visible=True)
    return axes


def set_raw_axes(axes, mt=rawmt, spp=spp_raw, with_xaxis=True):
    return _set_axis(axes, mt, spp, with_xaxis)


def set_one_axes(axes, mt=mt1, spp=spp_1step, with_xaxis=True):
    return _set_axis(axes, mt, spp, with_xaxis)


def set_five_axes(axes, mt=mt5, spp=spp_5step, with_xaxis=True):
    return _set_axis(axes, mt, spp, with_xaxis)


if __name__ == '__main__':
    # with plt.xkcd():
    if True:
        fig1 = plt.figure(figsize=(8, 6.0))
        gsIllust = gridspec.GridSpec( 22, 20, left=0.03, wspace=0.0,
                hspace=0.0, top=0.98, bottom=0.07, right=0.97)
        ax_illust_raw = fig1.add_subplot(gsIllust[1:7, 7:13])
        ax_illust_raw = set_raw_axes(ax_illust_raw)
        ax_illust_raw.xaxis.set_ticks_position('top')
        ax_illust_raw.annotate(
                'sequence\nof\nclusterings', (0.51, -0.2),
                xycoords='axes fraction', size=8, ha='center', va='center',
                fontweight='heavy',
                )

        ax_illust_one = fig1.add_subplot(gsIllust[10:25, :9])
        ax_illust_one = set_one_axes(ax_illust_one)
        ax_illust_one.patch.set_visible(False)
        ax_illust_one.set_title(
                '1-step history', fontdict={'fontweight': 'heavy'})
        ax_illust_five = fig1.add_subplot(gsIllust[10:22, 11:])
        ax_illust_five = set_five_axes(ax_illust_five)
        ax_illust_five.patch.set_visible(False)
        ax_illust_five.set_title(
                '5-step history', fontdict={'fontweight': 'heavy'})
        # plt.tight_layout()
        fig1.savefig('history.png')
        fig1.show()
The full script can be downloaded here.
Installation
You can get the latest version with
pip install --upgrade git+https://github.com/j-i-l/majortrack.git
